
They say that “Price is King” when it comes to trading. And it’s true. Understanding price is the number one priority in trading. Price drives most indicators, and therefore most trading decisions. We use price to identify all kinds of technical patterns, from Double Tops and Head & Shoulders, to Bullish Flags and Pennants, and so much more.
In all of these cases, we’re trying to predict where price is likely to go. For example, we may notice that every time price approaches a certain low, it fails to go below it and pulls back up, effectively ‘bouncing’ off of that support. When that happens twice, we call that a Double Bottom. If it happens three times, we call it a Triple Bottom. Typically, the more times price reverses at a support level like this, the less likely it is that price will break through it. Each touch makes the support stronger. We also know that if price finally does break that support, we can anticipate that all that pent-up energy that finally pushed it through the support will continue to push it further, making price soar lower, and our pockets jingle.
Many times, and maybe even most of the time, this approach works just as expected. We enter on a triple bottom support break and hit our target. But there are times when such an obvious move just doesn’t play out, and we take a loss when it reverses. It can be infuriating as a trader, especially since it seems to happen without warning.
But did it really occur without warning? Perhaps something else could have revealed that the follow through was unlikely, and we didn’t know about it. Is there something we’re missing other than price action alone?
The answer is, “Yes”. Price action alone doesn’t give us a complete picture. It shows us the history that price has experienced. It can identify trend, and price levels, but just that alone is not always enough. What’s missing is knowledge about the energy behind the move. That is, the power behind the move.
We call that power, Momentum. Described in Newton’s First Law of Motion, momentum states that an object will keep doing what it’s been doing until some other force acts on it. An object that’s not moving will stay at rest until some force moves it. Similarly, a moving object will continue moving in its current direction and speed until some force alters its path.
If an object has enough momentum as it approaches a barrier, its momentum can keep it moving right through that barrier. The greater the momentum, the greater the chance it has of moving through the barrier.
Let’s look at this another way.
Imagine a Karate instructor that’s trying to break a sturdy wooden plank. If the Karate instructor merely held her hand against the plank and pushed down, it would be hard to generate enough force to break it. For her hand to break through the plank, she must draw back her hand high above her head, and quickly move her hand down toward the plank and follow through, as if the plank weren’t even there.  To do this, she must combine the speed of her moving hand with the mass of her hand to provide enough energy to break it. This is literally momentum, which has the formula of speed times the mass (momentum = velocity x mass). The momentum of her hand is what allows it to break through the plank.
And not only does her hand break the plank, the momentum keeps her hand moving through the break. In fact, she must mentally visualize her hand passing through the plank as part of the discipline used to break it. At the moment of the break, she knew that it would not only break the plank, as she had visualized her hand moving beyond it.
Like this Karate example, our trade must have momentum in order to break through the previous prices. If we can identify the momentum of price as it approaches the support, then we can know with greater confidence that price is going to break through it this time. We can use Momentum and Price together to identify successful breaks and follow-through.
Now let’s think about that triple bottom example we discussed earlier. If we had a way of knowing the bearish momentum that’s behind price movement, we could compare the momentum now to what it was when it failed to break lower before. If we can determine that bearish momentum is stronger now than it was the last time, then we’d have insight into whether it’s likely to break through and go lower this time.
But how do we know what the momentum is? Though it’s easy to visualize price moving beyond support, it’s not quite as simple to “see” momentum.
In order for us to see momentum, we must look beyond price alone, and use mathematics of price movement to derive the momentum behind price. Now, if you’re a math hater, don’t be worried. Momentum calculation is done for us by indicators. But we still want to know what we’re looking at when we’re using a momentum indicator. What we’re looking for is the likelihood of follow-through.
Let’s look at an example. Here’s a chart that has created highs and lows in a range. Price has tested the low price indicated by the dotted line four times. How do we know that we’re going to break through on the next attempt to cross the line? More importantly, how can we have confidence that if it does break through, that it will run and not just reverse back up?
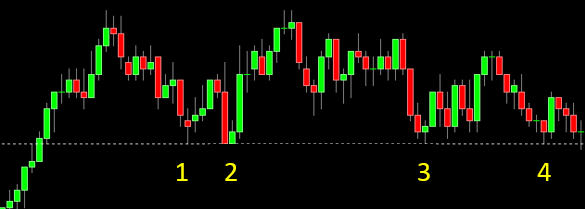
It’s challenging to know by looking at price alone. In fact, you could make a case that if we entered into such a consolidation from below, we’ll likely continue to run higher and exit the consolidation to the upside. We can also see that the highs are getting lower, but the lows are holding their ground, getting stronger on each retest.
So how do we gain the confidence that price will follow through on a break of support? Price action and technical analysis alone is giving us reasons to expect it to break higher and lower at the same time. If we could identify the momentum behind the price movement, perhaps that could give us more insight, and the confidence that we’ll break through and run in a specific direction.
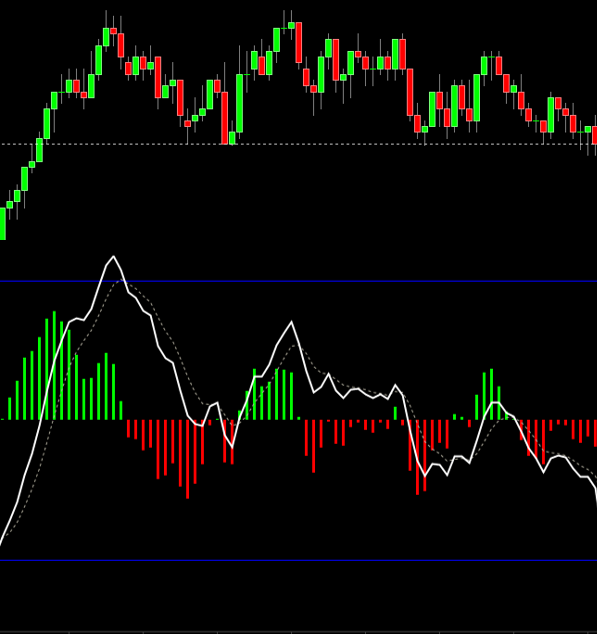
Let’s look at the same chart, and this time, with momentum. The momentum indicator below price is revealing the power behind the move.
So that we can refer to the chart, let’s identify the components of the momentum indicator.
The white line, called the Momentum line, effectively shows us the direction and speed of price. That is, where is price going, and how fast. It also shows the relative movement compared to previous momentum movement.
The dotted line smooths the momentum line a bit, to average out the bumps. The histogram bars reveal the power behind the move. That is, how strong the move is. The undrawn line that’s between the red and green bars is called the zero line. Whatever is above zero is generally positive and bullish, and whatever is below it is generally negative and bearish. It’s often helpful to consider green histograms as representing bullish movement, and red histograms as representing bearish movement.
Notice how the tallest green histogram bars show the power of the move as it rises on the left. You can see how that was the most powerful part of the move that’s shown in this picture by examining the other histogram bars. You can see how the Momentum line dips a bit on its way to that same peak as the corresponding price bars pause on the way up. Note that we do want this type of responsiveness in our momentum indicator.
Once price hits the peak, you can then see how the Momentum line reverses and heads back toward the zero line, quickly bringing our histograms into the negative bearish zone. Look at the rest of the progression on the indicator. The movement of the indicator continually coordinates with price over time. Each time price defines a reversal high or low, we have corresponding bounces in the Momentum indicator’s components.
Now let’s focus on those reversal points, or pivots, both on price, and on the momentum line. In the next diagram, the momentum line’s pivots are annotated with short lines here for clarity, green for bullish pivots, and magenta for bearish pivots. Look how well the high and low pivots on the price chart above it correspond to pivots on the momentum line.
Notice also, the height of the momentum line at each pivot compared to a previous high of the momentum line. Each momentum pivot high is clearly lower than the previous pivot. Similarly, each pivot low is clearly lower.
If we analyze the Momentum line like we analyze price, we can say that momentum is trending lower, with lower lows, and lower highs. Even though we keep hitting an equal low on price, the momentum indicator is telling us that there is more
bearishness with each pivot low.
When we recognize that the momentum line is trending lower even though price has equal lows, we are taking advantage of the hidden information that momentum is revealing. That’s powerful information. It means that even if price is finding support at the same price (and consolidating), it’s actually losing bullish energy and becoming more bearish. Our momentum indicator is clearly revealing that price is building up momentum to break lower. We can therefore anticipate a break lower with confidence.
Now look over to the far right of the price chart. If you look closely, you’ll notice that a little more time has passed than the first diagram. The price bars have finally broken the price support level. The question is, will it bounce back up from here, or will it run lower?
With price alone, it’s tough to tell. But when we add in the extra information that momentum has provided us, it gives us the missing piece of the puzzle.
You can see that we’ve extended the lowest magenta pivot line to the right as a dotted magenta line. Now, line up the point where price broke through our price support level with the Momentum line on the momentum indicator. It’s way over to the right in the image. Can you see that the white momentum line is pushing lower through that dotted magenta line? That tells us that there is increasingly bearish power behind the price move at the point the price break is occuring. There is enough bearishness to push the momentum line lower than the previous pivot. And what does that mean? Look out below!
Here’s the result on that break. Price not only moved lower, it surged lower. That’s not surprising considering the steep angle on the momentum line after breaking through the momentum pivot low.
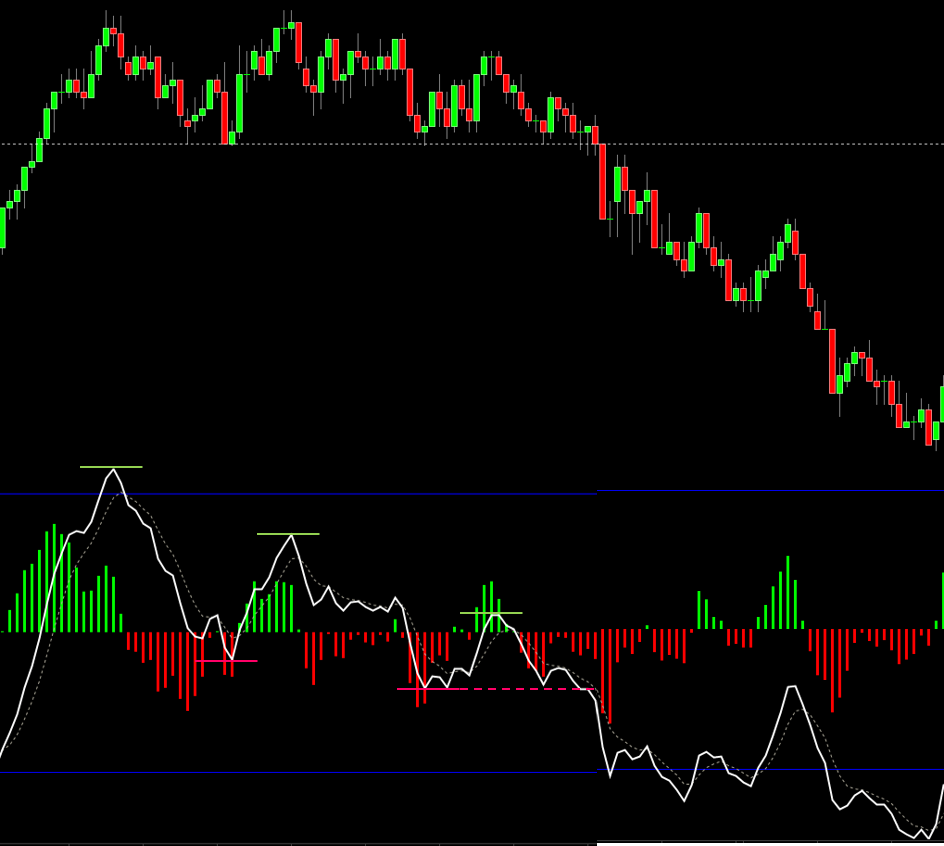 The momentum indicator revealed that the price support break we saw above was destined to succeed. When price was breaking the quadruple bottom price support, momentum was heading straight down, below a previous Momentum line pivot low. The results speak for themselves.
This is the kind of move that builds confidence in traders. That confidence is gained by using price action with the insight of momentum.
In fact, the momentum indicator is so critical to our trading at Basecamp Trading, we have our proprietary MQ Momentum indicator on every chart. That’s right. Every single chart. We don’t want to trade without it.
Once you understand the power of momentum in your trading, you’ll realize that trading without MQ Momentum is like flying without instruments. Sure, you can look out the windshield and see much of what’s going on, but bring in a little fog and you’ll be looking down at the gauges to keep you flying.
Just like when flying in the fog, trading can create its own fog when indecision appears. That’s what happened with our consolidation example above. The consolidation zone and even price action analysis created indecision. When we’re in a setup, we don’t want to enter a trade wondering if price is going to move our way. We want to know it will.
It’s so important in our trading that even when the price action is clear, we still confirm with MQ Momentum.
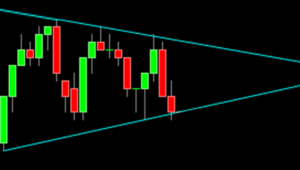 Let’s look at another example. Here we are in a pennant pattern, and price is breaking through the bottom pennant line.
Will it run? It’s difficult to tell from price alone. Yes, price is breaking the lower pennant line, but are we ready to put our hard-earned money on the line to trade this entry with expectation that it will go lower?
No worries, we don’t have to guess.
If we add in MQ Momentum, we get a better look at what’s happening behind price action. With the power behind price clearly revealed, we get the previously invisible momentum insight that gives us knowledge of whether this is likely to run in our expected direction.
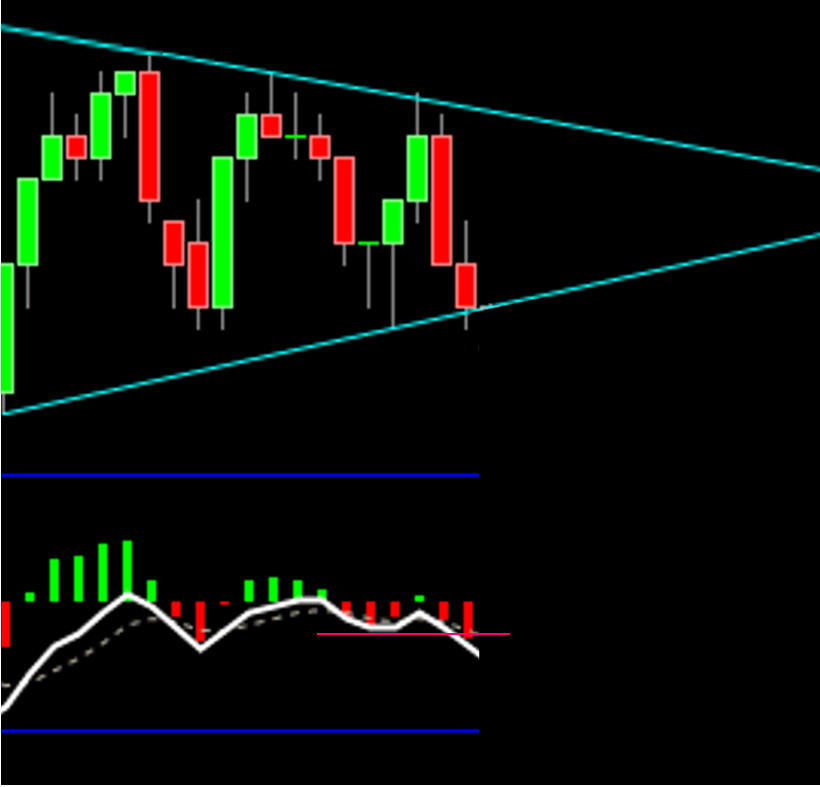 Here’s the same chart, with MQ Momentum added. Remember how we did the analysis above? We focus on the pivots. Not just on price, but also on the corresponding white Momentum line pivots in the MQ Momentum indicator.
If we look at the Momentum line pivots, we can find the current Momentum line’s position corresponding to where price is breaking through the bottom of the pennant. Can you see how the momentum line is going below the previous Momentum pivot low? The magenta line annotation here shows the previous momentum line pivot low, and that the momentum line is breaking below that pivot. That’s a sign that we’re increasing bearishness in momentum at the same time we’re breaking through the pennant. And what happens as a result?
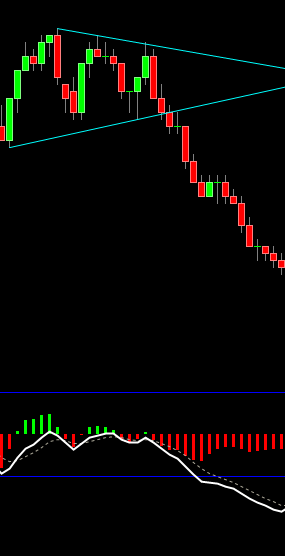 Another confidence-building move in our expected direction, thanks to confirming momentum at the point of the pennant break.
And look how the Momentum line continues to run after the break. If you’re a trader, you know that it’s sometimes hard to stay in a trade so that it runs all the way to your target. With the responsiveness of our MQ Momentum indicator, you’ll have the confidence to stay in the trade as it runs. You can see that as long as the Momentum line keeps dropping, we can continue to let the trade move lower, so you can stay in the trade to reach your target, and maybe even more.
But Wait… There’s More
MQ Momentum’s usefulness goes way beyond breakout confirmation. At Basecamp Trading, we use the MQ Momentum indicator for divergence detection, bullish and bearish price inflections, zero touch reversals, fingers, and so much more. We can teach you how to use MQ Momentum to reveal all of these powerful techniques.
By now, I’m sure you’re starting to see the importance of having a responsive indicator like MQ Momentum. And responsiveness is critically important. Yes, there are other momentum indicators that you can use in place of MQ Momentum, like MACD. But when you place them side by side with our streamlined MQ Momentum, you’ll find that they’re not as fast in pointing out the momentum changes, and they often miss some of the subtle fluctuations in price. Plus, MQ Momentum makes these critical subtleties much more obvious, and therefore easier to identify, and easier to trade.
If you’re using a less-responsive momentum indicator, it may not be giving you the confidence to get into the trade on the break, the divergence, or the many other momentum-related signals. Any lag in a momentum indicator may make you hesitate. Even worse, you may even find yourself chasing a trade as you await late confirmation, leaving profits on the table, and increasing your stop risk.
One of our instructors compared MQ Momentum as a Ferrari to MACD as a Camry. The Camry’s not a bad car at all, but it’s not a race car. MQ Momentum is the tuned race car for trading. Why settle for something that isn’t going to get you into trades at the right time? When you’re trading, you need an edge, and using MQ Momentum, the Ferrari of momentum indicators, can give you the edge to jump in ahead of other traders.
This is why all of Basecamp Trading Instructors devote space on virtually all of their charts to MQ Momentum. Trading with momentum is second only to price as the Key to Successful Trading. Make sure your momentum Key is for a Ferrari.
Want to get your copy right now? Click here to get MQ Momentum onto your own charts and see what a difference the confidence of trading with MQ Momentum can do for you.
Share Your Thoughts Below
Recent Related Articles


0 Comments