919-935-0010 support@basecamptrader.com
0 Items
Base Camp Trading
  • Home
  • Store
  • Videos
  • Articles
  • About
  • Support
  • MEMBER AREA
Select Page
What is a Momentum Divergence?

What is a Momentum Divergence?

by Thomas Wood | Oct 29, 2020 | Equities, Futures, Indicators, Trading Tips, Video of the Day | 0 comments

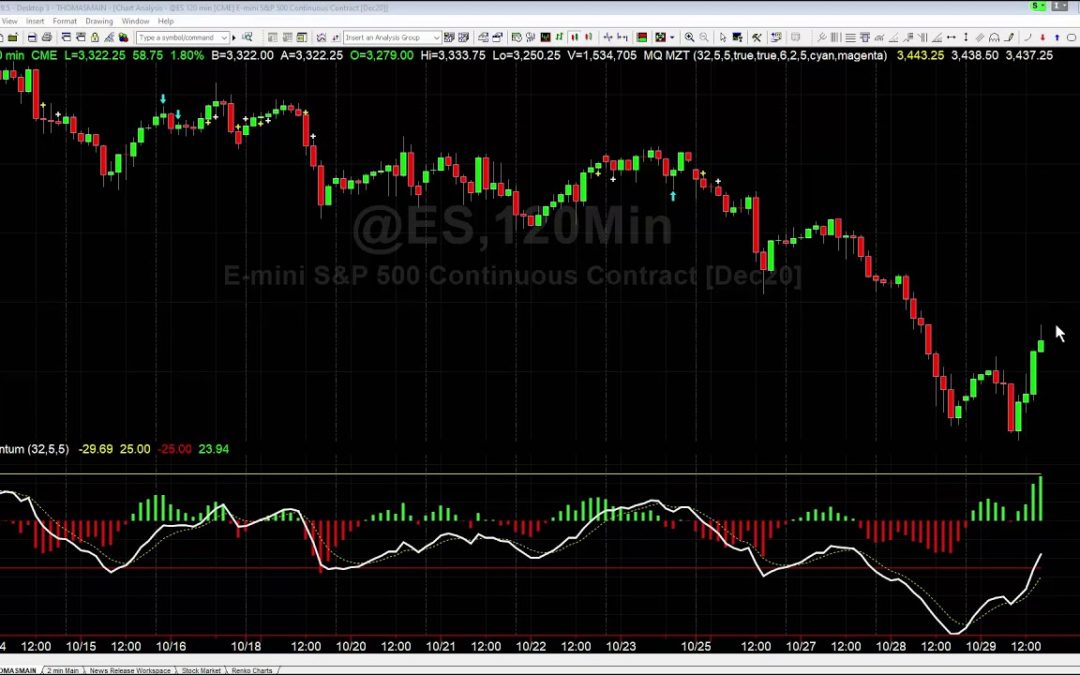
https://youtu.be/dQWtj3NFcxY Today we take a look at the S&P 500 futures (ES) and discuss exactly what a momentum divergence is using the MQ Momentum indicator. If you are interested in the MQ Momentum, it is available at www.basecamptrading.com  Recent Related...

Why We Bought the S&P Today

by Thomas Wood | Sep 25, 2020 | Indicators, Options, Video of the Day | 0 comments

https://youtu.be/CzT3Hcpv5bw Today we were buying the S&P 500 Futures Market. In this video, I explain what we were looking at that gave us a bullish bias. Recent Related Articles How to Avoid Walking Off a Cliff in Hiking, and in Trading by Drew Day | December...

Trading the MQ MZT On Crude Oil

by Thomas Wood | Aug 26, 2019 | Futures, Indicators, Video of the Day | 0 comments

https://youtu.be/GgjjCyC1bRUToday we take a look at the MQ MZT (Momentum Zero Touch) indicator and discuss how we can use this on a daily price chart to determine bias for intraday trades in Crude Oil futures.  Recent Related Articles How to Get Started with Trading –...

How to Check Market Correlation in TradeStation

by Thomas Wood | May 20, 2019 | Help, Indicators, Video of the Day | 0 comments

https://youtu.be/aDGn8NVloTIToday we discuss how to check the positive or negative correlations of two different markets using the TradeStation platform. You can use correlations to determine potential market bias based on other markets.  Recent Related Articles...

Plotting Indicators on Multiple Time Frames with TradeStation

by Thomas Wood | May 2, 2019 | Indicators, Trading Tips, Video of the Day | 0 comments

https://youtu.be/EehERsOHNbYToday we look at how to bring in multiple timeframe data and plot moving averages based on timeframes not shown on the current price chart in TradeStation. Specifically, we add a 9 EMA based on 240 and 480 minute price charts on our current...
MQ MZT Signals in Nasdaq

MQ MZT Signals in Nasdaq

by Thomas Wood | Apr 3, 2019 | Futures, Indicators, Video of the Day | 0 comments

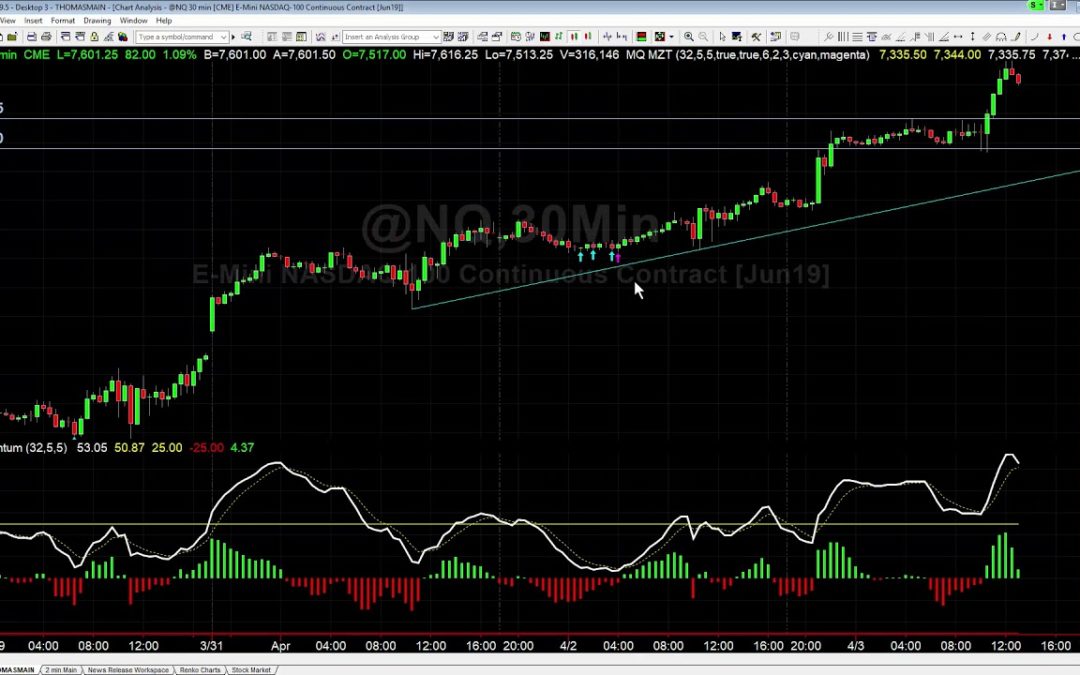
Today we discuss the long signals in the Nasdaq Futures (NQ) market that have triggered over the past few days from the MQ MZT (Momentum Zero Touch) indicator. This tool is coming out this afternoon, April 3rd, so make sure you get your copy during the launch special!...
« Older Entries

Recent Posts

  • Broad Market Breakdown and Targets

Never Trade Alone. Get Started Today!

Start Now
  • Home
  • Blog
  • About
  • Contact Us
  • Support
  • Partners
  • Facebook
  • X

Privacy Policy  |  Terms & Conditions

Base Camp Trading Headquarters
5540 Centerview Drive
Suite 204
Raleigh, NC 27606
Phone: 919-935-0010


©2025 MicroQuant℠ Patented - U.S. Patent No. 7,461,023 and other Patents Pending


IMPORTANT NOTICE! MicroQuant, LLC (MQ) does not hold itself out as an investment adviser or a commodity trading advisor. All information and material provided by MQ, including www.basecamptrading.com, is for educational purposes only and should not be consideredinvestment advice. Any opinions, research, analysis, prices, or other information contained in this material is provided as general market commentary and does not constitute investment advice or a solicitation to buy or sell any securities.Trading and investing are inherently risky activities and should only be undertaken by persons capable of accepting such risk and a possible loss of all the capital they commit to such activities, and in some cases even more. The information shown is for illustrative purposes and is not meant to represent any actual trading or investing results. No representation is made that any person using the services of MQ will be profitable or will not incur losses. Past performance is not necessarily indicative of future results.

NO REPRESENTATION IS BEING MADE THAT THE USE OF THIS STRATEGY OR ANY SYSTEM OR TRADING METHODOLOGY WILL GENERATE PROFITS. PAST PERFORMANCE IS NOT NECESSARILY INDICATIVE OF FUTURE RESULTS. THERE IS SUBSTANIAL RISK OF LOSS ASSOCIATED WITH TRADING SECURITIES AND OPTIONS ON EQUITIES. ONLY RISK CAPITAL SHOULD BE USED TO TRADE. TRADING SECURITIES IS NOT SUITABLE FOR EVERYONE. DISCLAIMER: FUTURES, OPTIONS, AND CURRENCY TRADING ALL HAVE LARGE POTENTIAL REWARDS, BUT THEY ALSO HAVE LARGE POTENTIAL RISK. YOU MUST BE AWARE OF THE RISKS AND BE WILLING TO ACCEPT THEM IN ORDER TO INVEST IN THESE MARKETS. DON'T TRADE WITH MONEY YOU CANNOT AFFORD TO LOSE. THIS WEBSITE IS NEITHER A SOLICIATION NOR AN OFFER TO BUY OR SELL FUTURES, OPTIONS, OR CURRENCIES. NO REPRESENTATI ON IS BEING MADE THAT ANY ACCOUNT WILL OR IS LIKELY TO ACHIEVE PROFITS OR LOSSES SIMILAR TO THOSE DISCUSSED ON THIS WEBSITE. THE PAST PERFORMANCE OF ANY TRADING SYSTEM OR METHODOLOGY IS NOT NECESSARILY INDICATIVE OF FUTURE RESULTS.

CFTC RULE 4.41 – HYPOTHETICAL OR SIMULATED PERFORMANCE RESULTS HAVE CERTAIN LIMITATIONS. UNLIKE AN ACTUAL PERFORMANCE RECORD, SIMULATED RESULTS DO NOT REPRESENT ACTUAL TRADING. ALSO, SINCE THE TRADES HAVE NOT BEEN EXECUTED, THE RESULTS MAY HAVE UNDER-OR-OVER COMPENSATED FOR THE IMPACT, IF ANY, OF CERTAIN MARKET FACTORS, SUCH AS LACK OF LIQUIDITY. SIMULATED TRADING PROGRAMS IN GENERAL ARE ALSO SUBJECT TO THE FACT THAT THEY ARE DESIGNED WITH THE BENEFIT OF HINDSIGHT. NO REPRESENTATION IS BEING MADE THAT ANY ACCOUNT WILL OR IS LIKELY TO ACHIEVE PROFIT OR LOSSES SIMILAR TO THOSE SHOWN.