
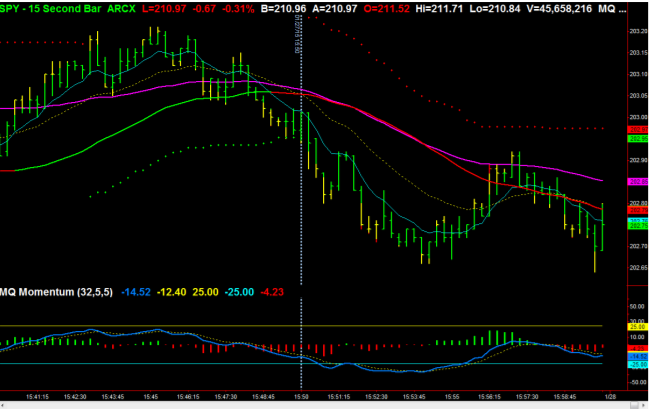
In the final thirty minutes of the market session, the indexes will either be moving in the dominant direction of the day or they will move in the direction of a snapback trade. When you get to the last 5 to 7 minutes of the session, take extra precaution with your trades. During this short time, the stock market experiences increased volatility, and prices move faster. An increased number of buy and sell orders usually causes prices to move erratically. Market on close orders especially can disrupt price patterns. Here’s an example of the final 20 minutes of SPY using 15-second bars. Notice the swings from a high of 203.20 to a low of 202.65. This translates into a 0.27% change in just a third of an hour, which if stretched into an entire session would be 5.3%. Obviously, the last half hour sees increased action compared to other periods of the trading session.
Trending Days Sometimes an index will break through the O.R. boundaries, and the resistance line will become the support line for the rest of the day, or vice versa. We call this a trending day, and we can see a good example of this action in the following chart with QQQ.
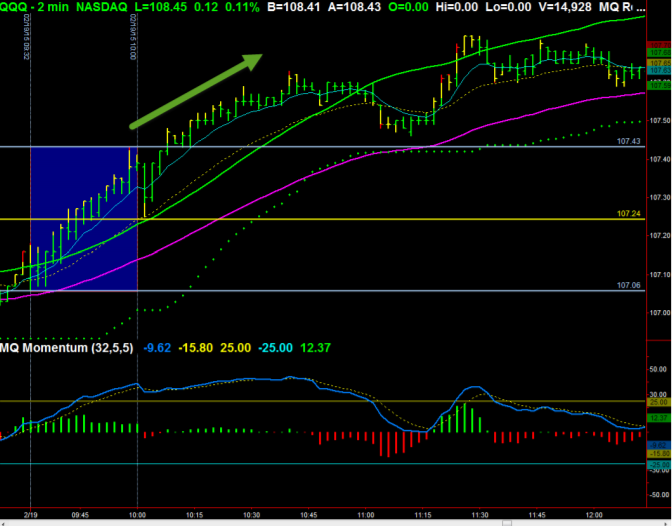
When you see that the O.R. high has been broken, momentum may take prices higher. Consider making bullish trending trades when you observe this kind of price action. This type of move out of the resistance line can be used as an entry point for a bullish play. Make sure you incorporate trend-following indicators here. On a trending day, keep an eye out for bull flags and bullish pennant markers. A bull flag resembles a flag flying on a flagpole. The pole is created from a steep rise in a security. The flag is produced from consolidation. The flag itself can be angled downwards or it can simply be a rectangle in the horizontal direction. The bull pennant is a short pause in the drift of a price in the middle of an uptrend. It will appear as a symmetrical triangle. When you get to the apex of the triangle, it’s a bullish entry point. A trending day can also be in a bearish direction. A good example is found on the chart below with 1-minute bars on SPY.
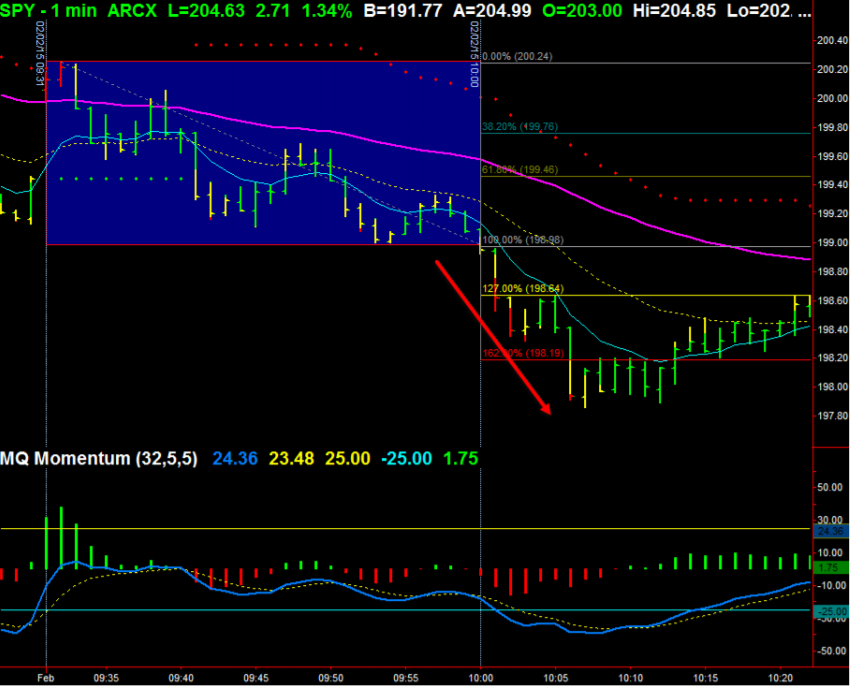
When the opening-range support level is breached, you can expect the price action to go lower. This will be an entry point for a bearish breakout, and you’ll want to use bearish trending trades. Use trend-following indicators just as you would with bullish movements. Just as with uptrends, downtrends can also develop flags and pennants. Holding Overnight As already mentioned, one of the primary advantages of day trading is that you exit your positions before the market closes, and this avoids any major price movements overnight. We continue to encourage our clients to follow this standard. However, if you have a position with a “profit cushion” you can consider holding for a continuation move the next trading day.
When considering holding a position overnight, evaluate the daily and 60-minute trend strength. Investigate the possibility that it could be part of a swing move of three to five days. Also consider taking some of the position off the table and carry over a partial position for the next day. If you decide to hold a position overnight, make sure your profit is enough to cover the morning gap we have already looked at. Account Size We don’t have any advice on account size to offer; but from our own experience, we have developed some general guidelines. First, incorporate your risk tolerance into your investment strategy. This should be based on your financial circumstances, the amount of risk capital you have, and your trading experience.
We have had success using the active-reserve account structure. Under this system, ⅓ of an account is for active trading, while the other ⅔ is put into reserve. For example, if you had an account with a $60,000 balance, $20,000 would be in the active section, while the other $40,000 would be in reserve. Of the active portion, we recommend using about 10-20% on a single trade. So in the $60,000 account, this would be $2,000 to $4,000 per trade. You should only have one active trade at any single time. We also recommend regular account harvesting. This is where you take half of your capital gains and transfer them out of your account so that the market cannot take back these profits. This should be done on a weekly basis. The other half of your earnings stays in the account. Remember to recalculate your account’s active and reserve amounts for the next week, as these figures will be changed by the income that is left in the account.
Growing an Account into Sustainable Profits An account’s growth is directly related to trading success, which in turn is influenced by consistent trading and regular improvements in investment skill. You should not increase your trading size if you feel increased market pressure (for example, if you find yourself thinking about the profit-loss margin more than the trade itself). As we mentioned in the previous section, these rules are not strict advice, but flexible guidelines that should help point you in the right direction. We recommend starting out in day trading slowly and not making large trades too fast. With time, you will gain experience, and with experience comes insight, understanding, and comfort. If you feel too much stress or discomfort, scale back your trades until you find a more comfortable environment. Through our experience with beginning traders, we have found it best to start with just one option contract per trade, then increase to two contracts once you become comfortable with the initial stage. You can then move to three, then four contracts. Next, try five. If you’re comfortable with that, you can increase your trades by two contracts per trade until you achieve the 10-20% of your account’s active portion that you’re aiming for. Chart Patterns to Look For When examining a chart, you need to be able to identify certain patterns. Since you’re not using fundamental analysis or other forms of security examination in your day trading, this ability is of paramount importance. Here are some of the chart patterns we teach our clients to look for:
Single Tops These graphs will show just one spike in a stock’s price action. The singletop chart is fairly common and should find success with just moderate bullish action that is against the opening-range high, or against the previous day’s highs.
- Double Tops (Bearish Divergence) Here you have a higher likelihood of success since you have two points of momentum and two prices to compare. There is a higher probability against an opening-range high and against previous daily highs. When using double tops and bearish divergence for your trades, you’ll want to enter at the second high. If it’s a bearish trade, you’ll want to start at the first lower low.
- Head & Shoulders (Triple Top) The double top/bearish divergence pattern could develop into a head & shoulders situation. In this case, you’ll want to take a bearish position when you see the right shoulder. This is going to be a decreasing momentum setup as the price begins falling from the right shoulder. While utilizing this strategy, you’ll want to implement a value reading for maximum efficiency.
- Single Bottoms These are somewhat regular. The price action of a security will come down for one dip and then bounce up off the opening range low. Alternatively, the price could hit the previous day’s low and then come back up.
- Double Bottoms (Bullish Divergence) There is a good probability of success here because there are two points of momentum plus two prices to compare. Double bottoms are fairly common. When making trades with double bottoms, be sure to enter at the second low as a bearish trade, or at the first higher high for a bullish trade.
- Inverse Head & Shoulders (Triple Bottom) A double bottom could develop into an inverse head & shoulders pattern; so be on the lookout for this. When you see it, you’ll want to place your trade at the right shoulder, for a bullish bet. This takes advantage of the momentum, which is bullish. Also be sure to incorporate a value reading for maximum efficiency.
Trade Setups For a bullish breakout, like the one we saw on the QQQ chart, you’ll want to be watching for a “last kiss” retest of the price action before it continues on higher. For a bearish breakout, keep an eye on moves below the O.R. low. As with bullish breakouts, you may see a last kiss on the lower level before the index or stock continues downward.
Overview of Typical Trading Day
Before the market opens, you’ll want to take a look to see if any major news has affected the markets. For example, if a war has been launched in the Middle East overnight, it would probably affect the price of that oil contract you were planning to trade after the market opens. Also look for any major economic reports that have been released. You should be following these on an economic calendar; so be ready on the date and time they are scheduled to be announced. Before the market opens, review yesterday’s high and low levels. Doing so will help you to gauge whether the market open is a gap up or down. Correct preparation will help you start trading effectively right away.
Next Steps To join our growing community of traders, please do not wait another second to join us in our exclusive trading service by CLICKING HERE
Recent Related Articles