Learning to Trade with ValueCharts®
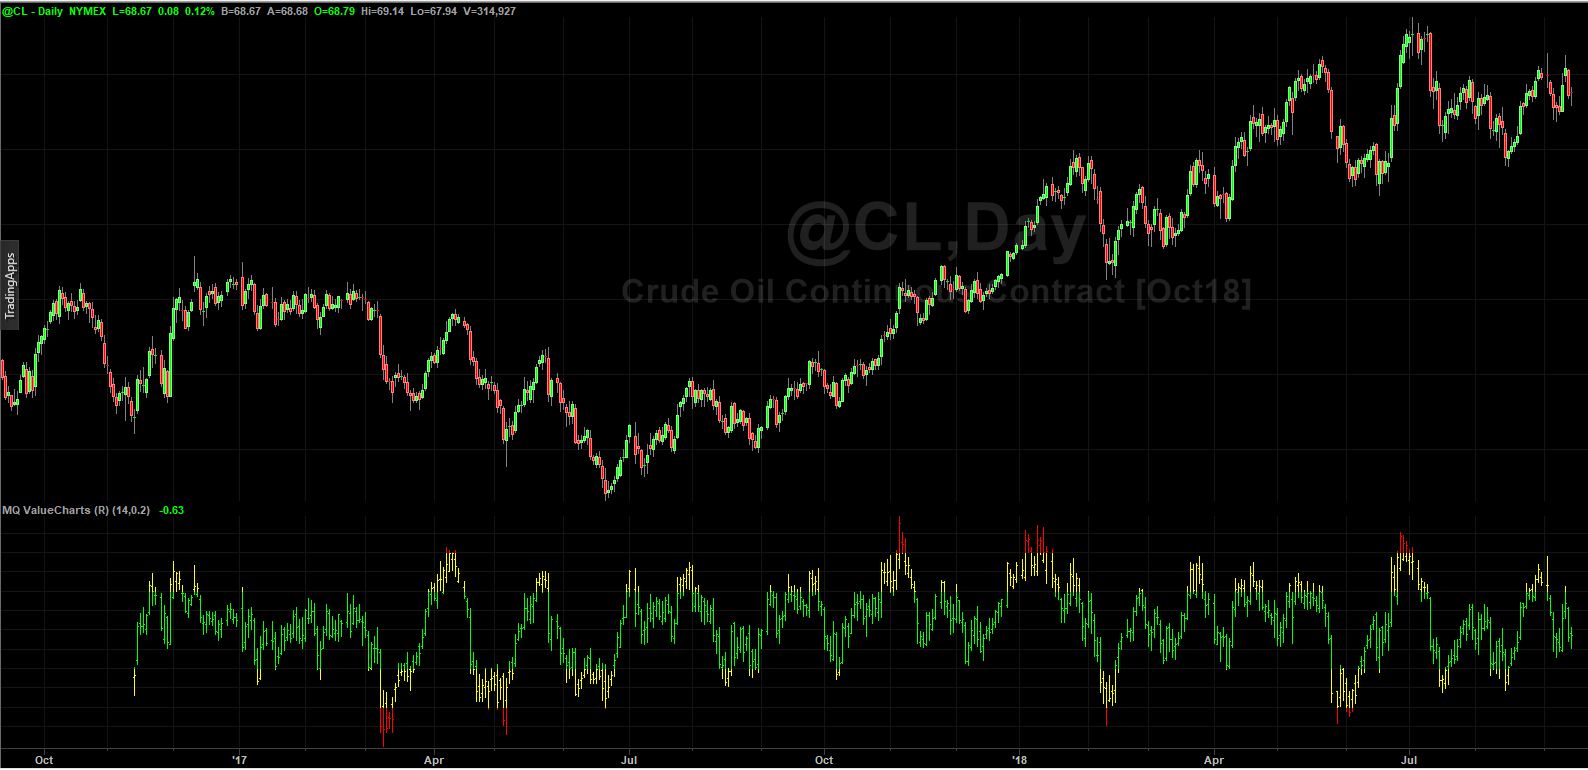
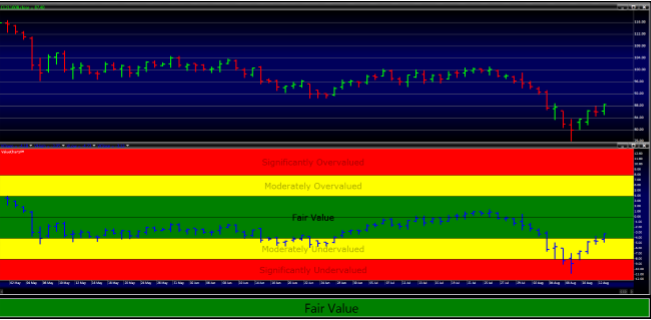
Now that we know that a ValueChart® is organized into five basic valuation zones, it is easy to learn how to read a ValueChart®. The default color scheme in ValueCharts® has been designed to make reading ValueCharts® easy. In addition, every ValueChart® includes watermark labels within each of the five valuation zones, including the current or active valuation zone which should have a highlighted watermark label. The watermark label for the active valuation zone where prices are trading appears in bold. Note that Crude Oil in the chart below is trading in the fair value zone and the watermark label appears in bold. In addition, a status bar is located below the ValueChart® that communicates the current valuation zone for a market. Note in the Crude Oil chart below that the status bar is colored green and is labeled “Fair Value.” These features enable traders and investors to read ValueCharts® quickly and easily.
Daily Crude Oil ValueChart® Trading at Fair Value
When generating a ValueChart®, traders and investors need to select two primary characteristics of each ValueChart® that will determine the timeframe focus. These two inputs include:
- Data Compression or Aggregation (or Timeframe)
- Evaluation Period (or Lookback Period)
- Selecting the Data Compression or Aggregation (or Timeframe)
When creating a ValueChart®, there are two primary determinations that a trader or investor will have to make. First, similar to a traditional chart, the trader or investor will have to select a data compression (or timeframe). The Crude Oil chart displayed above was created from daily price bars. Like traditional bar charts, ValueCharts® can be constructed using timeframes ranging from 1-minute price bars to monthly bars, and beyond. In other words, traders and investors can construct ValueChartsSM with 1minute price bars, 5-minute price bars, 15-minute price bars, 30-minute price bars, 60minute price bars, daily price bars, weekly price bars, and monthly price bars. In addition, ValueCharts® can be constructed from volume bars and tick bars as well. ValueCharts® can be constructed from any of the same price bar aggregation methods that we can use to make traditional bar charts.
- Selecting the Evaluation Period (Lookback Period)
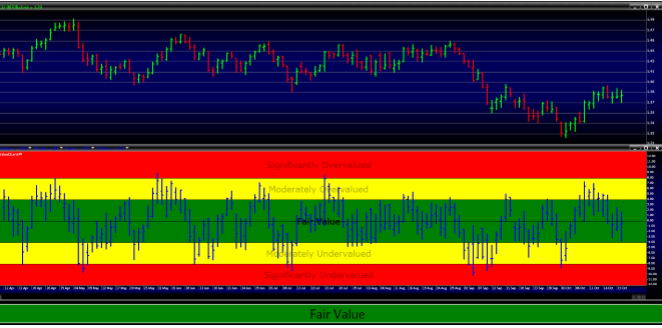
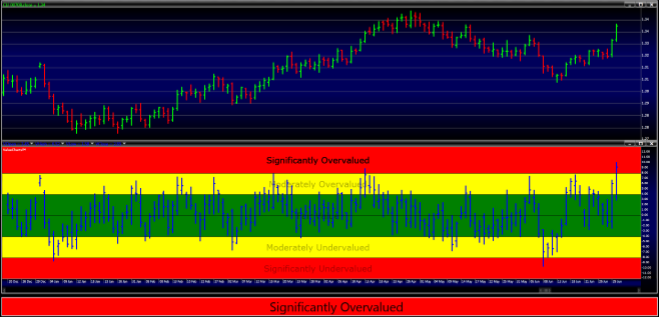
The second consideration when creating a ValueChart® is determining the evaluation period, or the lookback period. In general, ValueCharts®can be effectively constructed from lookback periods ranging from 5 bars to 50 bars. It is important to remember that Valuation is time-dependent. What does this mean? In simple terms, this means that a valuation can be short-term, intermediate-term, or long-term in scope. It is possible for a market to be short-term undervalued and long-term overvalued. When constructing a ValueChart®, after a timeframe (data compression or bar compression) has been selected, a lookback period between 5 and 50 bars must also be selected. If a trader has a short-term focus and is looking to profit from a quick pop in prices, he or she would want to focus on smaller lookback periods of 5 to 15. Intermediate term traders could use lookback periods ranging between 14 to 35 bars. And long-term traders could use lookback periods of 35 bars to 50 bars. When refining the focus of a ValueChart® to short-term, intermediate-term, or long-term, traders and investors can adjust both the timeframe of the price bars along with the lookback period. This process often involves tinkering with these settings and trying different timeframe and lookback period combinations. On the following page are two chart examples of Crude Oil ValueCharts® using a daily timeframe with different lookback periods. The first Crude Oil ValueChart® is constructed using daily price bars with a 5 bar lookback period. The second Crude Oil ValueChart® is constructed using daily price bars with a 50 bar lookback period. The first ValueChart® has a shorter-term scope as it has a lookback period of 5 bars, the smallest lookback setting. Note that this ValueChart® is trading within the moderately overvalued range. The second ValueChart® has a longer-term scope as it has a lookback period of 50 bars, the largest lookback setting. Note that this ValueChart® is trading within the fair value range.
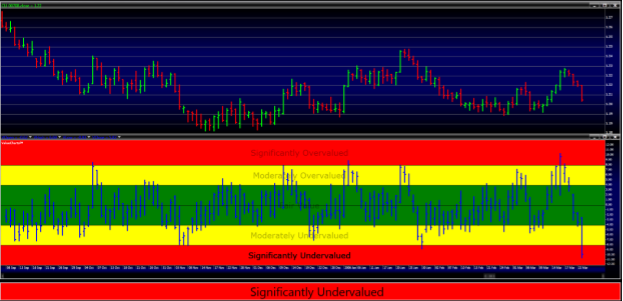
Daily Crude Oil ValueChart® with 5 Bar Lookback Period
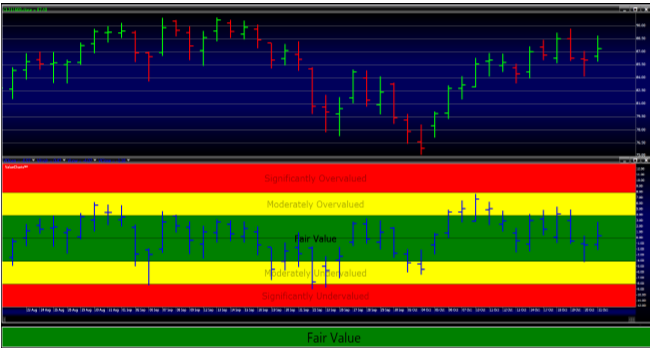
Daily Crude Oil ValueChart® with 50 Bar Lookback Period
Even though the two Crude Oil charts on the previous page chart Crude Oil for the same date range, they are at different valuation levels because the lookback period is different. This highlights the fact that market valuation is time-dependent. It is not uncommon for a real estate market to be short-term undervalued and long-term overvalued. For this reason, it is important for traders and investors to calibrate the ValueChart® to their individual investment time horizon. A day trader using ValueCharts® might construct a ValueChart® using 5-minute price bars with a lookback period between 5 and 21 bars. A trader with an intermediate time horizon might use 240-minute price bars or daily price bars with a lookback period between 5 and 35 bars. Long-term investors might only use daily and weekly price bars with a lookback period of between 14 and 50 price bars. Of course, every trader and investor will have to determine his or her optimal ValueChart® settings.
Reviewing the Five Valuations Zones Unlike an appraisal in the housing market or the Blue Book in the pre-owned automobile market, ValueCharts® provide traders and investors with much more than a single valuation level. ValueCharts® not only define a fair value price range, but also define overvalued and undervalued price ranges as well. Below is a short summary of the implications of price trading in each of the five valuation zones.
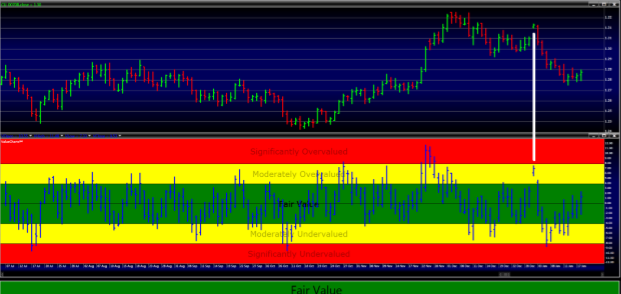
Fair Value Zone The fair value zone encompasses the majority of trading activity for any ValueChart®. This valuation zone contains approximately 68% of the trading activity for any ValueChart®. The benefit of placing trades within the fair value zone is that you will not be entering a market at an extreme, which means that you will not be at risk of getting in at a market extreme and placing a buy order at an overvalued price level or a sell order at an undervalued price level. When you trade within fair value, you will not be entering or exiting a position at extremely desirable or extremely undesirable price levels. Trades within fair value are often not going to be at the best price levels, nor are they going to be at the worst price levels; they are going to be a fair price levels.
Euro Currency Futures trading within the Fair Value Zone
Significantly Overvalued Zone The significantly overvalued zone represents an extreme valuation zone within a ValueChart®. In general, 2.5% of trading activity occurs within this zone. Buyers beware when placing orders to go long in a significantly overvalued zone. Remember, we are not dealing with absolutes when we discuss the implications of prices within this valuation zone. This means that prices trading within the significantly overvalued zone can continue to rise. This is especially true when there is a short squeeze in a market or there are extreme fundamental factors causing a runaway bull market. However, typically, when prices reach the significantly overvalued state, they are overdone and probabilities favor the market returning to fair value sooner than later. This valuation zone often represents an excellent place to take profits or go short. However, when doing this, traders and investors should have confirming signals from other indicators and or have confirming fundamental analysis supporting a decision to do this. I would not recommend shorting a market simply because it was trading within the significantly overvalued state. The odds for success are dramatically increased when combining several effective market analysis tools whenever making a trading decision.
Euro Currency Futures trading within the Significantly Overvalued Zone
Notice the four days that followed our significantly overvalued close in the chart above. In this case, the market didn’t reverse and fall back in the traditional price chart. Prices in the traditional chart held steady while the ValueChart® prices returned to the fair value zone. When this occurs, it often indicates that a follow through to the upside can take place. Although prices didn’t reverse or fall back in this case, there are many times when they do. Therefore it is prudent to pay attention when prices enter the significantly overvalued zone.
Days Following Significantly Overvalued Prices
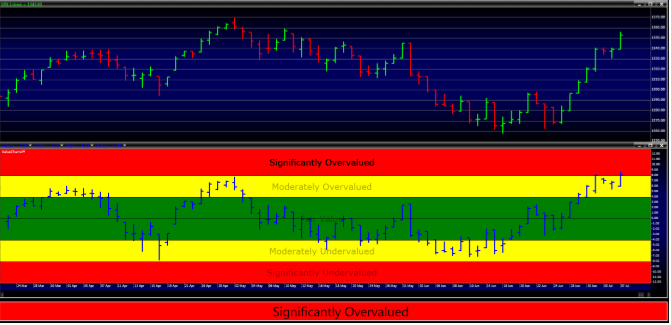
The S&P 500 chart (first chart on the following page) displays a daily ValueCharts® with a 14 bar lookback period. As we can see, the S&P 500 closed at significantly overvalued on July 7, 2011. What does this mean in practical terms? Again, when a market is significantly overvalued, it has potentially reached an extreme price level and is due to correct or even reverse directions. Buyers should exercise extreme caution when buying a market that is significantly overvalued. On the following page we display a chart showing what the S&P 500 did on the days that followed this significantly overvalued state.
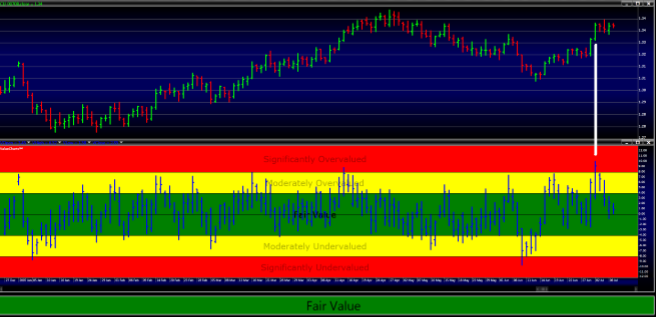
Daily S&P 500 ValueChart® with 14 Bar Lookback Period
Days following Significantly Overvalued Reading
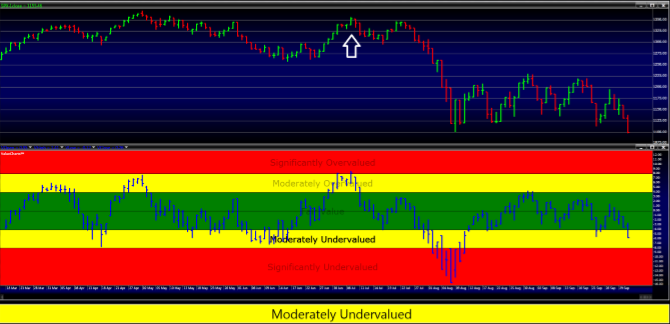
As it turns out, the significantly overvalued price level on the daily ValueChart® of the S&P 500 was the high of the price move to the day (see white arrow in chart above). Now, we need to make an important point. When discussing the implications of markets trading at certain valuation levels, we always speak in terms of probabilities and never in terms of absolutes. Yes, in the above example, it would have been great to either exit our long positions at the exact top or to initiate a short position at this exact top in the S&P 500. However, if we inspect the ValueChart® of the S&P 500 on the previous page we can see that the S&P 500 was also significantly overvalued on July 1, 2011, three days prior. In this case, the market proved to move a bit higher before it ultimately reversed directions. Although July 1 would have also been a great place to take profits or initiate a short position, it was not the exact top in the price move. Unfortunately, many people end up actually buying in valuation levels like this (white arrow in chart above). For any buyers who entered the market in this significantly overvalued area, there was virtually no opportunity for profit. The market reversed from these levels and never looked back.
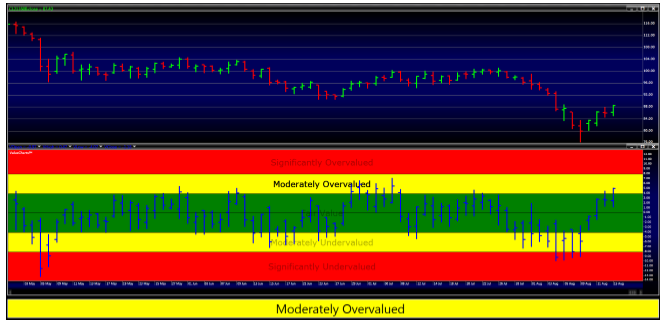
Moderately Overvalued Zone The moderately overvalued zone represents overvalued prices within a ValueChart®. In general, 16% of trading activity occurs within or above this zone. Buyers need to be aware that prices within this zone are overvalued, and therefore should use caution when buying within this valuation zone. Similar to the significantly overvalued zone, this zone can represent an attractive place to take profits or potentially go short on a market. The same cautionary language applies here as well, however. I would not recommend shorting a market simply because it was trading within the moderately overvalued state. The odds for success are dramatically increased when combining several effective market analysis tools whenever making trading decisions.
Euro Currency Futures trading within the Moderately Overvalued Zone
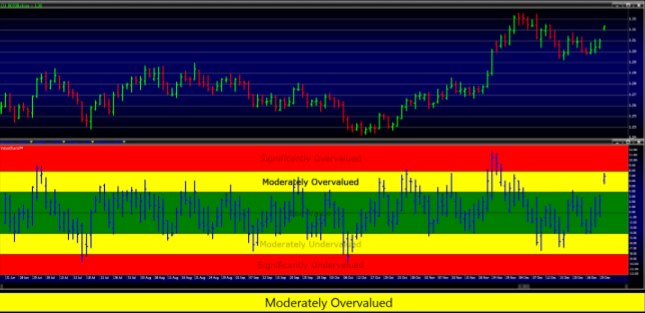
Days Following Moderately Overvalued Prices
Notice that the Euro currency market reversed hard after the failed gap up into the moderately overvalued price zone. In this case, either taking profits or selling short would have represented an excellent trade.
Significantly Undervalued Zone The significantly undervalued zone represents an extreme valuation zone within a ValueChart®. In general, like the significantly overvalued zone, 2.5% of trading activity occurs within this zone. Short sellers beware when placing orders to sell within a significantly undervalued zone. Remember, as before, we are not dealing with absolutes when we discuss the implications of prices within this valuation zone. This means that prices trading within the significantly undervalued zone can continue to fall. This is especially true when there is a flash crash or a market panic.
Euro Currency Futures trading within the Significantly Undervalued Zone