
Mastering Reading Price Action Is an Absolute Must!
Base Camp Trading Can Show You How to Increase Your Profit Potential With Fewer Trades
If you’re looking to up your game in the world of securities trading, perhaps it’s time to focus on learning how to follow and trade from an asset’s price action. Mastering charts should be the first step to improve your trading. And we’re not just talking about stock charts here; futures, options, and forex all have price action—so they are fair game, too. Once you learn how to interpret price movements on a chart, you’ll be ready to trade with the best of them.
Here at Base Camp Trading, we have helped thousands of traders become more efficient at trading stocks and other assets simply by showing them how to correctly follow price movements on a graph. Once you learn the fine details of price action, you’ll have more confidence and lower stress when you’re placing your trades. You’ll also be able to realize greater profitability with less time actually trading.
To get started trading equities and other financial instruments, you first want to build a foundation that will serve as a starting point for your trading journey. We call that foundation Base Camp. Here, we give you the knowledge and skills you need to succeed. You will also start to develop the mindset that is necessary to survive trading equities and other quick-moving financial instruments.
Chart Basics
When we teach traders how to improve their game, charting is one of the first lessons we go over. With more than 50 combined years of trading experience, we know some proven strategies that will bring your trading to new heights.
But first, you must learn the basics. We recommend starting off with a simulator. There are many brokers and financial websites that offer simulated trading for free. You’ll want to use one of these to practice with a virtual currency so there’s no risk involved. Simulated trading offers a great environment in which you can practice what you’re learning with zero loss of capital.
Of course, you’ll want to be sure you have a graphing program as part of your simulated trading platform. Practicing the chart skills you’re learning is a key component to your trading journey. Not all simulators offer graphing capability, so be sure to choose one that has the ability.
Setting Up the Graph
Here at Base Camp Trading, we typically use candlesticks or OHLC bars on our charts to show the price action of a financial instrument. Most graphing programs offer a variety of chart styles; but these won’t always give you the ability to see the tick-by-tick movements that are so important when making trading decisions. Line and area styles, for example, won’t show you the highs and lows an asset reaches from one point to the next. Let’s say you choose a one-minute interval over one day. The line or area graph will be constructed with minute-by-minute prices, but you won’t see any of the highs or lows the asset reached within the minute. With candlesticks and bars, you get to see the interval’s high and low points along with open and close prices; and these are vital to making correct trading decisions.
Pivot Points
Now that you have the graph set up and ready to go, let’s take a look at an example. Here’s a 5-day chart of the S&P 500 index fund IVV. Each candlestick represents five minutes of price history.
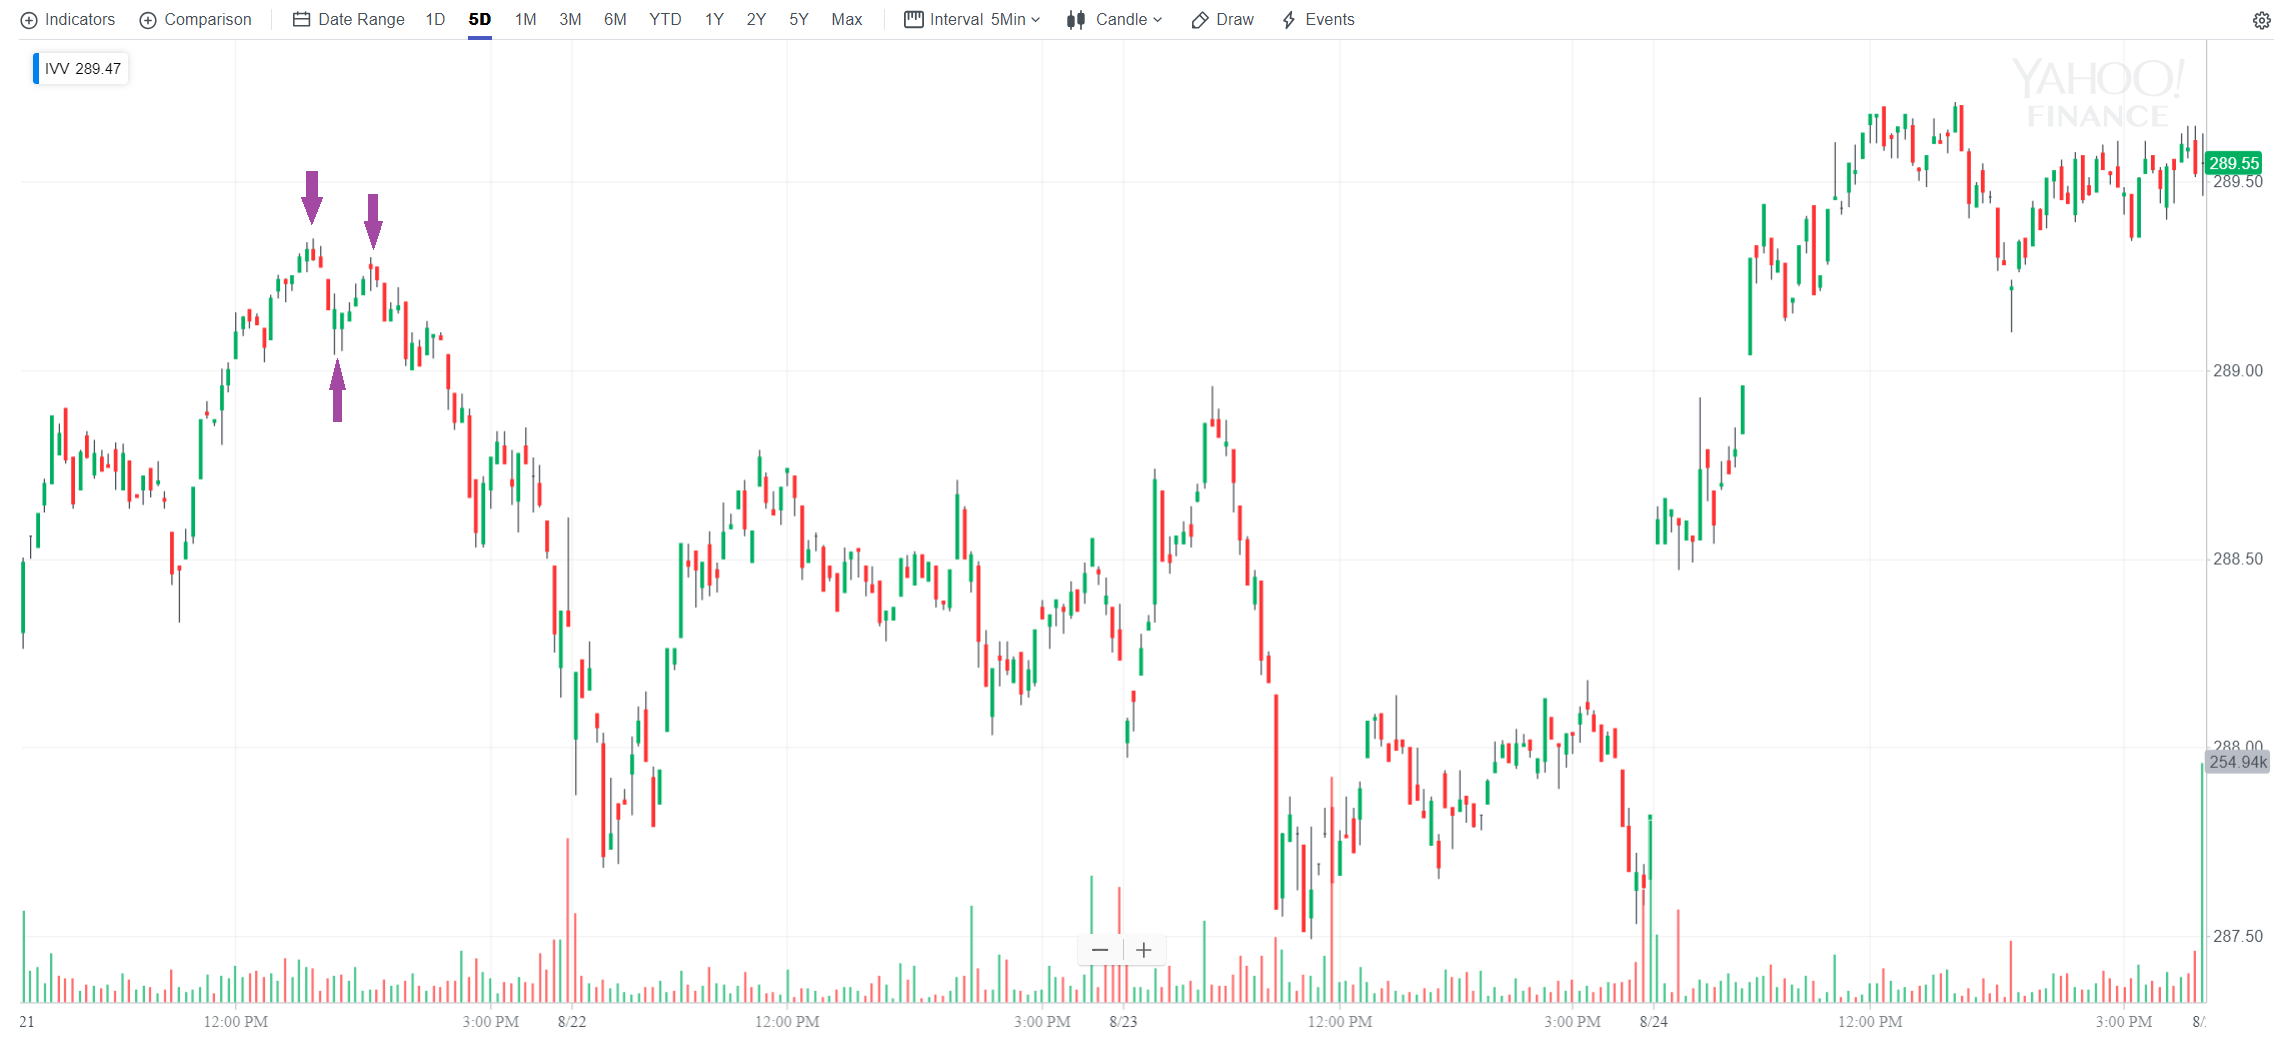
The taller the candlestick, the more volatility the price experienced during that time. A green candlestick means that the price ended higher compared to the previous candlestick, while red shows the opposite. (Not how candles work)
When the price moves to a certain point and is rejected, we call it a pivot point. Notice that around 12:55 pm (need to tell them to reference price chart and have an arrow pointing to “Pivot 1” or something) , the ETF suddenly reverses its upward trend and quickly drops. Twenty minutes later, the pull back ceases, and the price begins ticking back up. Another pivot. A half hour later, the trend reverses. These are important watersheds because they are involved in signaling entry and exit points, which we’ll look at shortly.
In order for a section of a chart to be considered a pivot point, you need to have several price bars up and then down on either side (or vice versa). Three on each side will work, but no less than that.
For obvious reasons, the two pivot points on our graph that are at the top are called pivot highs, and the one on the bottom is called a pivot low.
Trends
Now we come to another topic in the world of technical analysis, and that’s trends. There are uptrends and downtrends. Whenever you start seeing higher highs, pivot after pivot, and higher lows, one pivot to the next, that’s an uptrend.
Each subsequent pivot must have a higher high and a higher low than the previous pivot in order for it to be an uptrend. If you have higher highs but lower lows, that’s just increased volatility. There’s no trend there. For a downtrend, you want to see lower highs and lower lows, pivot after pivot. Using drawing tools in your charting program can help you better visualize these.
Anywhere you don’t have a downward trend or an upward trend, the chart is said to be in consolidation/reversal. Your goal is to trade in a trend. You don’t want to trade within a period of consolidation/reversal because there’s no consistent pattern here.
When examining the price action of a stock, option, futures contract, or currency pair, try to place your trades during periods of expansion. Be careful to avoid periods of compression. Expansion is where profit potential lies, while compression offers smaller and smaller price movements. Markets move through these two phases quite frequently, and it’s important to incorporate them into your trading decisions.
Trading Micro-Trend Breakouts
A micro-trend breakout is a lower pivot high during an uptrend or a higher pivot low during a downtrend. Say for example that you see a downtrend in crude oil futures. You’re getting lower highs and lower lows. But then you get a brief session of higher highs and higher lows. This is a micro-trend, and it presents a brief trading opportunity.
Line in the Sand
A line in the sand connects two pivots. You can use a drawing tool in your software program to create this line. Anytime the market breaks this line, you want to place a trade. The trade will be short term because when the market breaks the trendline, we look for it to accelerate back in the direction of the original trend.
No Technical Indicators
Keep in mind that we’re not using any technical indicators here The chart shown below has several indicators on it. Need to change that if we are going to make this statement. These are simply basic drawing tools placed on price patterns. We call this naked trading. It’s just a price chart without any sophisticated programs telling you to buy or sell. We know this style of trading works because we’ve profited from it many times before.
Example With Crude Oil Futures
To give you an idea of how to use a line in the sand during a micro-trend breakout, let’s take a look at the following one-day chart on crude oil futures. This is not a one day chart, is a 500 tick chart showing just a couple hours of price action.
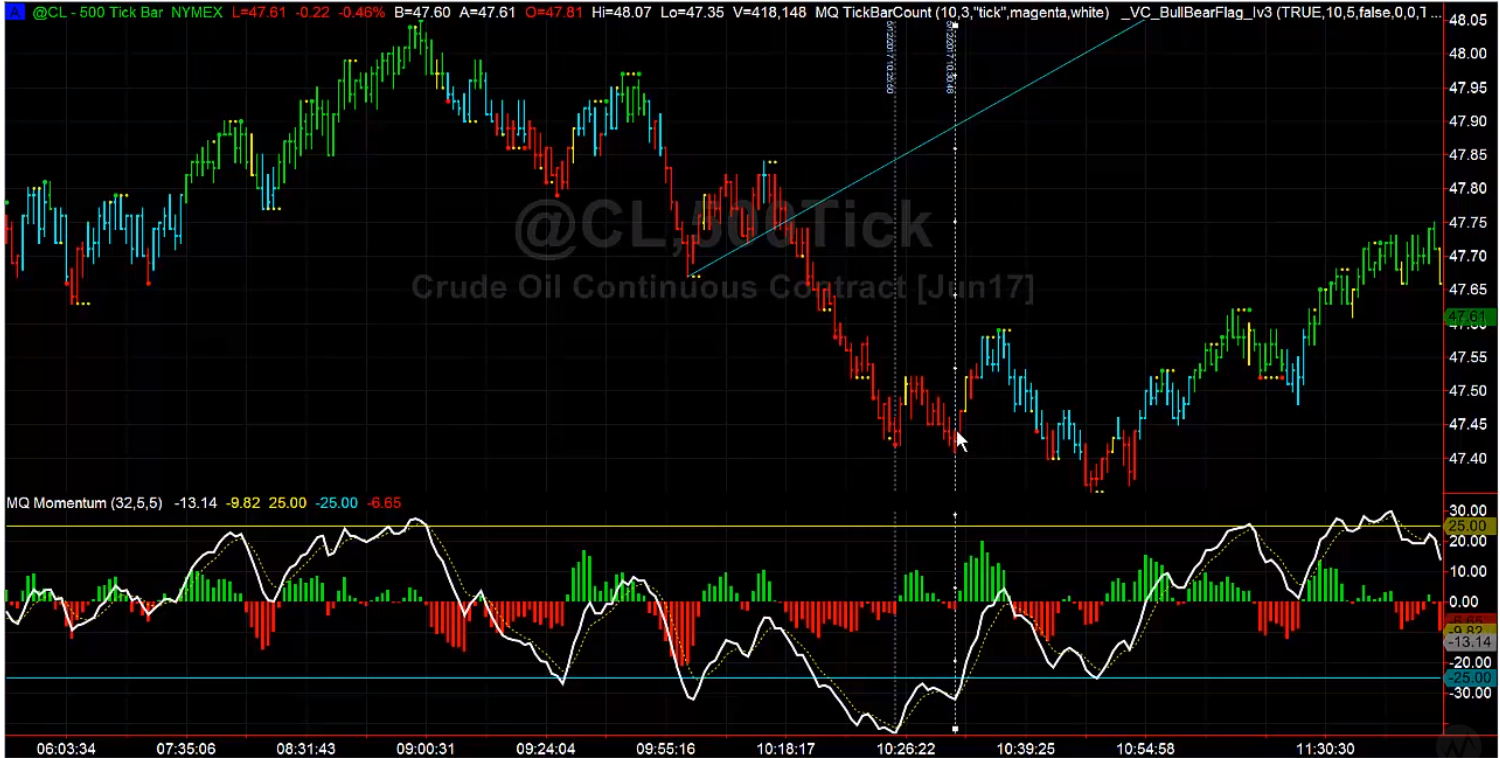
There is a brief period that has broken the downward trend. It occurs around 9:55 am. There are two pivot lows, and we can connect them with a line in the sand. When the price action drops below the line, it’s a sell signal. You want to enter the trade two or three ticks below the line. In this example, that’s about 47.72.
When you enter the trade, you’ll want to be sure to include a stop loss order. This should be about 8 ticks above the sale price; so 47.80 would be a good choice. This will immediately create a maximum loss, so you can’t be blown out of the water with a single trade. Just because you place a stop loss, does not mean that is max loss. There is slippage that can occur. Additionally, stops are placed above the previous price bars high for a short entry, so 8 ticks is not always correct.
When the price returns to its downtrend trend (and we see that it does below our line), you should adjust your stop loss order to follow the price action down.
Bullish Divergence (if this is focusing on price action and naked trading, then they cannot see divergences)
When the price action reaches a bottom around 10:30 am, we come across a bullish divergence. A bullish divergence occurs when you have two pivot lows that are equally low without two lows on a momentum indicator.
We won’t get into technical indicators in this article. During the Ascent phase of Base Camp Trading’s educational program, we go into technical studies in much greater detail. But you do want to be aware of how they can be used along with chart patterns.
You can see on our chart how the second bottom in the price action corresponds with a much higher point on the momentum graph. This is an indication that it’s time to leave the short position because the price is fixing to go back up. It’s important to recognize double bottoms and double tops on price charts because you’ll see them frequently.
The place you would want to exit the trade is around 47.48. This would produce about 24 ticks of profit with only about 8 ticks of risk. That’s a great risk-reward profile.
If you look at the chart closely, you’ll find another bullish divergence. Can you find it? It occurs around 10:45 am. You can see it on the price action and in conjunction with the momentum indicator.
Day Trading v. Swing Trading
When you’re trading from charts, you can either day trade or swing trade. Day trading is defined as buying and selling the same instrument within a single market day. Swing trading, on the other hand, is slightly longer term—a hold period of anywhere from two days to two weeks. The strategies presented in this article have demonstrated effectiveness in both day trading and swing trading.
When trying to choose between day trading or swing trading, you should first think about the amount of price movement you expect from the financial instrument. The shorter expected move, the shorter you should plan to stay in the trade; and the longer the expected move, the longer you should plan to stay in. If you think a natural gas futures contract is going to drop for ten minutes, then obviously day trading would be a wiser choice in this situation. But if AT&T is rising on an upbeat conference call, this trend will probably continue for some time.
Don’t Forget Rules Off the Chart
Whichever timeframe you choose, you’ll first want to evaluate yourself and your goals before you sit down at the computer and start trading. You need to make sure you have the right mindset before you start placing trades. Are you ready for the volatility you’ll probably experience? Day and swing trading both have risks and characteristics that need to be fully understood before jumping in and putting real money on the line.
Speaking of real money, at Base Camp Trading we recommend only using risk capital for your trades. Risk capital is money you can afford to lose. You shouldn’t trade with money you need to pay your mortgage, for example.
You need to operate by a set of rules and have a specific game plan when you start your morning. During the trading day, you should stick to your plan and keep your emotions at bay. By following a pre-defined set of rules, you’ll be better equipped to survive, and even profit from, a world that offers risk but also endless profit potential.
Time for Change?
Albert Einstein once defined insanity as “doing the same thing over and over again, but expecting different results.” If you’re getting the same abysmal results from different trades you’re placing, it’s definitely time to shake things up a bit. If you have developed a losing method, now it’s time to develop a winning method. Don’t’ keep making the same mistakes over and over again. With the help of Base Camp Trading’s coaches, you’ll be able to break free of losing patterns, and learn how to rise above traders who don’t know what they’re doing.