
“As a general rule, the most successful person in life is the person who has the best information.” Benjamin Disraeli
________
How to Become a Better Trader with Value Charts®
Have you ever felt the sinking feeling that comes right after you have overpaid or been ripped off? That must be one of the worst feelings in life. On the flip side, have you ever experienced the positive feelings associated with getting a special deal when taking advantage of a rare bargain? All these emotions relate to the issue of value. Make no mistake, understanding the value of an asset is powerful information that can give you a huge advantage over other buyers and sellers in any market! Imagine having the ability to know what any asset is worth. Not how much it costs…but what it is worth. You would be able to see right through the asking price in any market in the world and know whether the asset was worth buying. You would be able to know which assets were overvalued, which assets were undervalued, and which assets were priced at fair value. With this powerful information, you would never again overpay for any overvalued (overpriced) asset. And, more importantly, you could use this powerful information to snatch up any undervalued assets that you happened across. Then, you could immediately turn around and sell these assets at fair value for a quick profit. There are two components to the price of every asset; the cost of the asset and the value of the asset. Although knowing the cost is easy, understanding the value of an asset is more difficult. In fact, understanding the value of an asset is the most powerful and relevant information you need as a buyer or seller in any market. Most investors assume that you must be an expert to understand the value of a particular asset. Certainly, this is true in the housing market as appraisers are needed to accurately assess the value of individual properties. And, in general, this has been a true assumption in many markets historically. But all of that is about to change. What if I told you that there is powerful new investment technology that would allow you to immediately understand the valuation of any stock, ETF, FOREX market, or futures market? What if I told you that this new technology is easy to learn and easy to use? And what if I told you that you didn’t need to be an expert to use this new investment technology, would you believe it? Throughout history, if you traveled anywhere unfamiliar to you, you would need a guide. Then, as things progressed, maps were developed, which allowed a common person to navigate where they wanted to go with little or no assistance. I am sure that people before our time would have never been able to imagine technology like the GPS.
Think about the power of the information that a GPS provides. It allows you to know exactly where you are on planet Earth and it tells you exactly how to get to any destination, anywhere! In fact, GPS is so powerful that many experts believe GPS technology is the single most important game-changing technology ever developed for the military. Even more powerful than nuclear weapons! The power of information cannot be understated. This article will introduce you to the innovative, and patented, value-based charting tool for the markets called ValueCharts®. We have all looked at price charts that display price in terms of cost. Now, with ValueCharts®, you can now view price in terms of value as well. And the best news is that ValueCharts® have been designed to be easy to learn and easy to use. I would never travel without GPS, and I would never trade or invest without ValueCharts®. Welcome to the exciting new science of market valuation, or as we like to say, the next generation of technical analysis.
The Power of Value ($100,000 in Profits before Noon)
I remember a good friend of mine was shopping for an oceanfront house, or to be more accurate, a bay front house in Florida. This was back when the real estate market was really starting to heat up right after the turn of the century. Early one Saturday while reading the real estate classified ads in the local paper, my friend noticed that a bay front house was being offered at a price which was significantly below the market. Because my friend understood the value of oceanfront property in Naples, Florida, he was quick to identify this undervalued property and he was quick to rush over and take advantage of this undervalued asset. Within minutes of learning about this property, my friend had quickly gone over and bought the property from the owner. Not more than ten minutes after my friend had arrived, another enthusiastic buyer showed up to buy the house as well, but it was too late because my friend’s offer had already been accepted by the seller. Even knowing that the seller, who was an elderly man, had already agreed to sell the house to my friend, the second man still went as far as to offer $10,000 more than my friend agreed to pay for the house to steal the property from my friend. Fortunately, the seller was an honorable man and he remained committed to my friend even though he could have made more money with the second buyer. My point with this story is to say that information, especially relating to the value of an asset, is very powerful. And powerful information has a good deal to do with success in any field. My friend, who was able to identify an undervalue asset and act upon a short-lived opportunity, was now in the driver’s seat as he could have turned around the sold the house for an immediate profit of $50,000 to $100,000. Not bad for one hour’s work! Unfortunately, the seller of the property was not familiar with the valuation of real estate in his area and, because of this, he lost a significant amount of money by selling his property at a price well below fair market value. Now that we can see the power of value-based information for a market, we are ready to learn about one of the most exciting new investment technologies developed in recent years, ValueCharts®. This article is going to teach you how to use ValueCharts®. This powerful value-based tool is easy to learn and easy to use. Once you understand how Value Trading works, you will be more of a value expert than most market participants (traders) in the world.
What are ValueCharts®?
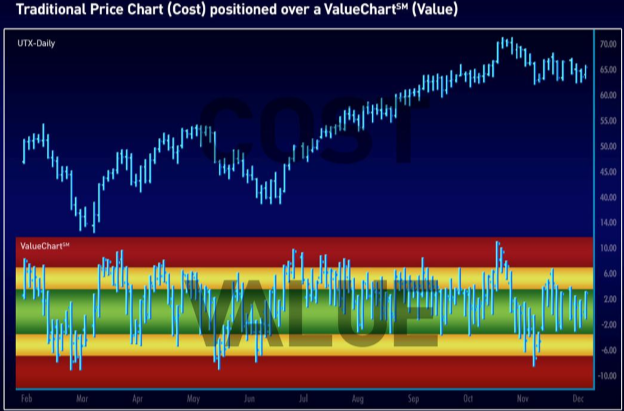
We are all familiar with traditional price charts. Traditional price charts, which display price in terms of cost, represent one of the most widely used market analysis tools in the world. They clarify the historical range that a market has traded within, key market support and resistance levels, and both current and historical trends. What most people are not aware of is that cost is only one component of price. Value is another component of price. In fact, value represents the more important component of price relative to cost. Other than affordability considerations, cost really is a trivial number when making an investment decision. It is the like change in cost that we are most concerned with. When buying or selling any stock, for example, we are concerned with realizing a profit. We are only concerned with selling a stock at a higher price than where we bought it. This means market participants must be willing to pay us more in the future for our stock than we paid in the past. The chart below displays a traditional bar chart (top) positioned over a ValueChart® (bottom). The top chart plots price in terms of cost whereas the bottom chart, the ValueCharts®, plots price in terms of value.
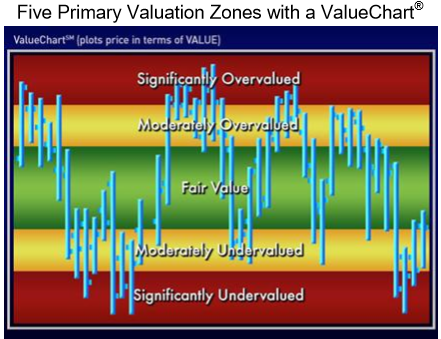
What exactly is value? Historically people have thought of value as a single price level that reflects the worth of an asset as defined by market participants. Something is only worth what people are willing to buy it for or what people are willing to sell it for. In extreme cases, if there are no buyers for an asset it is worthless and if there are no sellers of an asset it is priceless. Dictionary.com defines value as “relative worth, merit, or importance,” or, in another definition, as “monetary or material worth, as in commerce or trade.” Anther definition of value that I like is “the attractiveness of price as defined by market participants.” Expanding on this, the term valuation might be defined as “the relative attractiveness of price as defined by market participants across a range of different price levels.” Now that we understand the definition of value, the next logical question is “What are ValueCharts®?” ValueCharts® are like a Super Blue Book for the markets. Like the Blue Book used in the used auto industry, ValueCharts® can be used to define fair value. ValueCharts® go well beyond the Blue Book by defining fair value as a price range instead of a single price level. In addition, ValueCharts® define overvalued and undervalued price levels as well. Specifically, ValueCharts® define the valuation of any market by plotting price in one of five primary valuation zones (listed below). The five valuation zones are colored coded to allow investors to quickly and easily identify the current valuation state of any market. The five valuation zones are as follows:
It is important to realize that the valuation of a market is not a single price or a single price level. The true valuation of a market is actually a price continuum. Because markets are comprised of a multitude of buyers and sellers, each with different hopes, fears, and agendas, a single price level is inadequate in describing the valuation of an entire market.
The design of ValueCharts®, which organizes the charting window into five primary valuation zones, makes it very easy for traders and investors to understand the current valuation of any market. The valuation zones were established by using common statistical measures as a guideline (above). However, it is not necessary to have any knowledge of statistics to use ValueCharts®. In review, ValueCharts® is a charting system that displays price in terms of value instead of cost. Like traditional charts, traders and investors can use either real-time data or delayed data when generating a ValueChart®. If real-time data is used, the ValueChart® will reflect the real-time valuation of the market under consideration. In addition, ValueCharts®can be constructed from the same types of data compression (or timeframes) used in building traditional charts (1-minute price bars, 5-minute price bars, 60-minute price bars, daily price bars, volume bars, tick bars, etc.). In the next section we will learn how to read a ValueChart®.